OpenLayers is a powerful JavaScript tool that enables us to create and display all sorts of maps on a website. This article will guide you in adding a point and a line string feature, then transform their projections to use coordinates, then add some colour by setting the layer’s style.
Please note that you need to have a working OpenLayers map installed in a webpage to follow this article. If you don’t have one, see How to Make a Map Using OpenLayers 3.
StepsPart 1Part 1 of 3:Adding Point and Line String Features1Create a point feature. Simply copy the following line of code into your <script></script> element:.var point_feature = new ol.Feature();2Set the point’s geometry. To tell OpenLayers where to place the point, you need to create a geometry and give it a set of coordinates, which is an array in the form of . The following code creates this and set’s the point’s geometry:var point_geom = new ol.geom.Point( );point_feature.setGeometry(point_geom);3Create a line string feature. Line strings are straight lines broken into segments. We create them just like points, but we provide a pair of coordinates for each point of the line string:var linestring_feature = new ol.Feature();4Add the features to a vector layer. To add the features to the map, you need to add them to a source, which you add to a vector layer, which you can then add to the map:var vector_layer = new ol.layer.Vector()})map.addLayer(vector_layer);Part 2Part 2 of 3:Transforming the Features’ Geometries to Use Coordinates
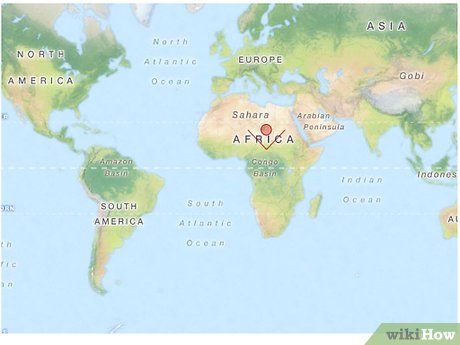
As with any powerful mapping software, OpenLayers maps can have different layers with different ways of displaying information. Because Earth is a globe and not flat, when we try to display it on our flat maps, the software has to adjust the locations to match the flat map. These different ways to display map information are called projections. To use a vector layer and a tile layer together on the same map means we have to transform the layers from one projection to another.
1Put the features into an array. We start by putting the features we want to transform together into an array that we can iterative through.var features = ;2Write the transform function. In OpenLayers, we can use the transform() function on the geometry object of each feature. Put this transform code into a function that we can call later:function transform_geometry(element) ); var new_projection = tile_layer.getSource().getProjection(); element.getGeometry().transform(current_projection, new_projection); );}3Call the transform function on the features. Now simply iterate through the array.features.forEach(transform_geometry);Part 3Part 3 of 3:Setting the Vector Layer’s Style
To change what each feature on the map looks like, we need to create and apply a style. Styles can change colours, sizes, and other attributes of points and lines, and they can also display images for each point, which is very handy for customised maps. This section isn’t necessary, but it is fun and useful.
1Create the fill and stoke. Create a fill style object and a semi-transparent red colour, and a stroke (line) style that is a solid red line:var fill = new ol.style.Fill();var stroke = new ol.style.Stroke();2Create the style and apply it to the layer. The OpenLayers style object is quite powerful, but we’re only going to set the fill and stroke for now:var style = new ol.style.Style(), fill: fill, stroke: stroke});vector_layer.setStyle(style);
3Check out the finished map.


